
Diverse Applications:
Precision Asset Validation & Risk Mitigation
Real Compounds. Real Studies. Real Findings.
Where Preclinical Science Meets Decisions That Matter.
Every example on this page comes from real-world examples including peer-reviewed publications, conference-presented research, and masked case studies. These are not simulations. They are real studies, real compounds, and real findings — many of which changed the direction of the projects or programs that generated them, providing critical de-risking data for asset valuation and licensing decisions.
✓ NIH/SBA SBIR/STTR Vetted & Phase I/II Funded
✓ Academically Validated
✓ FDA-Acceptable Non-GLP Preclinical Data
✓ >40% Animal Reduction (FDA 3Rs Initiative Compliant)
Case Study 01: Bridging the Diagnostic Gap
Acute Identification of Sub-Clinical Asset Risk
NEPHROTOXICITY DETECTION
Published: Clinical Cancer Research, 2019
The Scenario: Acute safety validation of a clinical-stage oncology agent at Day 5 post-treatment. At the Day 5 interval, standard clinical chemistry for Cisplatin (CDDP) returned Creatinine values within the expected reference range. Within the context of standard acute screening, this asset would be categorized as "Safe."
However, TITAN™ dynamic imaging identified active, localized renal tubular insult during this acute phase—capturing the onset of damage while blood panels remained silent. This sub-clinical finding was subsequently validated via H&E histopathology and TUNEL staining, proving that TITAN™ detects pathology that standard biomarkers miss in the critical early windows of a study.
Insight: The elevated BUN/Creatinine ratio was not dehydration; it was the "metabolic smoke" from early-stage intrinsic renal injury.
Asset Impact: TITAN™ provides a "Truth Layer" in acute safety assessments, preventing the advancement of compounds with hidden toxicities that standard blood panels are not sensitive enough to capture. This protects the valuation of the portfolio by identifying "Kill" candidates before they reach expensive Phase 1 human trials.
Model: Sprague Dawley Rats
Drug: Cisplatin
Dose: 2.5 mg/kg, Single Dose I.P. Administration
Visualization: Day 5 Post-Treatment
Parameter | Result (Mean ± SD) | Typical Rat Range | Interpretation |
|---|---|---|---|
Albumin | 2.89 ± 0.12 g/dL | 2.5 – 4.0 g/dL | Normal. This is comfortably within the expected range for a healthy adult rat. |
BUN | 15.27 ± 4.48 mg/dL | 10 – 25 mg/dL | Normal. This indicates the kidneys are processing nitrogenous waste effectively. |
Creatinine | 0.29 ± 0.12 mg/dL | 0.2 – 0.8 mg/dL | Normal (Low-End). This is a healthy reading, though very low values sometimes reflect low muscle mass. |
BUN/Creatinine | 54.93 ± 11.74 | 20 – 35 (approx.) | High. This ratio is significantly elevated. |
The Diagnostic Trap: A ratio of ~55 with "normal" Creatinine is frequently dismissed in research as mild dehydration or dietary fluctuation. Without imaging, the underlying pathology may be missed.

Direct Tissue Visualization: While the blood chemistry suggested the rats were "healthy but dehydrated," Discovery Imaging with TITAN™ provides clear, direct evidence of cortical tissue damage bilateral kidney signal with noted elevated radioactivity uptake in cortical regions showing spatiotemporal elements of tissue damage. This technology identified the specific anatomical regions under stress long before the functional output of the kidneys (Creatinine) was compromised. Histopathology confirms acute tubular damage confirmed in cortical region with enhanced apoptosis via TUNEL and H&E staining validates imaging findings structural damage visible at tissue level.
Insight: The elevated BUN/Creatinine ratio was not dehydration; it was the metabolic "smoke" from early-stage intrinsic renal injury.
The Conclusion: Sensitivity Matters
TITAN™ revealed that considerable tissue damage was already evident, pinpointing the "Silent Window"—the crucial time frame when tissue damage occurs without yet compromising function. By offering direct visualization of tissue changes, TITAN™ highlights the "Silent Window," allowing for:
-
Earlier Detection: Spot injuries days ahead of standard biomarkers indicating "failure."
-
Increased Sensitivity: Differentiate between metabolic noise (such as a high BUN/Creatinine ratio) and genuine structural necrosis.
-
Higher Confidence: Correlate imaging hotspots with histopathological validation
-
Early damage identification compared to traditional serum biomarkers.
-
Elimination of ambiguity in statistically significant but "clinically normal" blood results.
-
Reduction of animal count by obtaining definitive structural data from each subject.
"Direct visualization of tissue damage provides a sensitivity advantage that standard clinical chemistry panels simply cannot match."
— Reference: Johnson et al., Clinical Cancer Research, 2019
Case Study 02: Exploratory Toxicology
Moving from "Selective Sampling" to Whole-Body Certainty
COMPREHENSIVE MULTI-ORGAN ASSESSMENT
Quantitative 4D Analysis
Same Animal Set from Example 1 Expanded
Published: Clinical Cancer Research, 2019
The Scenario: Expanding the Cisplatin assessment from a localized renal study to a systemic, multi-organ safety audit in the same individual subjects.In conventional toxicology, researchers are forced to gamble on which tissues to examine. If damage occurs in an unexpected site—such as the pancreas or bone marrow—it is often missed unless specifically targeted for histopathology. TITAN™ eliminates this "Target Selection Bias" by capturing 22+ tissues simultaneously in a single, quantitative 4D visualization. By mapping the response of the whole body in real-time, we transform a single time point into a comprehensive systemic analysis. This reveals heterogeneous cytotoxic patterns—showing how different organs exhibit different kinetics and severity within the same animal.
Insight: You don't have to be looking for a specific site of injury to catch it. TITAN™ identifies the "off-target" effects that traditional protocols routinely overlook.
Asset Impact: This provides Systemic De-Risking. For an M&A lead, this is the ultimate "Insurance Policy" against unforeseen toxicities. By seeing everything and missing nothing, you gain the certainty that if damage exists anywhere in the body, it is accounted for—long before it causes a failure in clinical trials.
Model: Sprague Dawley Rats
Drug: Cisplatin
Dose: 2.5 mg/kg, Single Dose I.P. Administration
Visualization: Day 5 Post-Treatment

Quantitative 4D Mapping
4D plot map transforms a single time point into a comprehensive systemic analysis, providing deep insights into both the individual subject and the broader cohort.
✓ Individual Animal Tracking
-
Identify subject variability and specific progression markers within the cohort
✓ Population-Level Trends Across Cohort
-
Visualize overall cohort patterns visible while maintaining high-resolution individual data
-
Maximize statistical power from complete datasets
✓ Multi-Organ Toxicity Patterns
-
Capture damage across the WHOLE BODY captured simultaneously - Not just single primary target organs/tissues
-
Comprehensive organ coverage in single visualization
-
In-depth systemic analyses possible in same animals in real time
✓ Tissue-Specific Response Profiles
-
Reveal how different tissues/organs exhibit different kinetics and severity
-
Heterogeneous cytotoxic tissue damage patterns revealed
Exploratory Toxicology: The Power of Total Visibility
Moving from "Selective Sampling" to Whole-Body Certainty
In conventional toxicology, researchers are forced to gamble on which tissues to examine. If damage occurs in an unexpected or unforeseen site, it is lost. TITAN™ minimizes this risk by capturing the WHOLE BODY in a single, quantitative 4D visualization providing simultaneous systems-, individualized- and population-based data.
RESULT: Beyond Predicted Pathology
Standard protocols require you to SELECT which organs to examine (typically 5–10 tissues like the Liver, Kidney, and Heart). With TITAN™, you SEE EVERYTHING.
-
Comprehensive Coverage: All organs and tissues are captured in a single whole-body scan, including a standard list of 22 tissues analyzed in every scan that can be expanded, reduced, or otherwise customized to each sponsor's needs.
-
Discovery-Driven: No prediction needed. You don't have to be looking for a specific site of injury to catch it.
-
Systemic Clarity: Identify heterogeneous cytotoxic tissue damage patterns that localized biopsies may miss.
The Comparison: Why Whole-Body Matters
Traditional Approach | TITAN-RX™ Advantage |
|---|---|
Selective: Must predict 5–10 expected tissues. | Global: Every tissue captured in one scan. |
High Risk: Damage in unsampled tissue is MISSED. | Total Security: Catch what's missed; no prediction required. |
Localized: Deep dive into limited areas. | Systemic: In-depth analysis of the entire system in real-time. |
"TITAN™ provides exploratory toxicology at its most powerful—seeing everything, missing nothing, and providing the certainty that if damage exists anywhere in the body, it is accounted for."
Case Study 03:
DYNAMIC PROGRESSION TRACKING
Quantifying the "Spatiotemporal Truth" of
Asset Toxicity
Published: Clinical Cancer Research, 2019
The Scenario: Longitudinal tracking of Cyclophosphamide cytotoxicity across a 7-day window to map the onset, peak, and recovery of tissue-specific damage. Traditional toxicology relies on "Terminal Snapshots"—different animals sacrificed at different days. This creates a fragmented, high-noise dataset where individual biological variability can mask the true kinetic profile of the drug. TITAN™ transforms these "snapshots" into a continuous "film" by tracking the exact same subjects from Baseline through Day 7. By using each animal as its own baseline control, we eliminate the "Biological Noise" of multi-animal cohorts. This allows for the identification of "responders" and "non-responders" within the same study, providing deep insights into the spatiotemporal dynamics of how different tissues (Gut, Thymus, Spleen, Kidneys) recover or decline at different rates.
Insight: Toxicity isn't a static event; it’s a progression. TITAN™ captures the entire story, revealing that injury in the Gut and Thymus can follow completely different kinetics within the same subject.
Asset Impact: Total Kinetic Certainty. By capturing the full temporal curve in a single group, TITAN™ maximizes statistical power while significantly reducing the need for satellite animal groups. For M&A due diligence, this provides the 3Rs Advantage — a more ethical, more efficient, and more accurate validation of an asset's safety threshold.
Model: Sprague Dawley Rats
Drug: Cyclophosphamide
Dose: 80 mg/kg, Single Dose I.P. Administration
Visualization: Dynamic Through Day 7 Post-Treatment
Cyclophosphamide Cytotoxicity — Longitudinal Imaging
Traditional toxicology relies on "snapshots" of different animals sacrificed at separate intervals, creating a fragmented view of drug effects. TITAN™ captures the entire story by tracking the same animals across the entire study duration.
Importantly Each Subject Serves As Its Own Baseline Control Simultaneously Enabling Dynamic Individualized and Population-Level Analyses! NO MORE MISSING!

Dynamic imaging of cyclophosphamide treated rats. Signal changes in representative tissues from male rats before and 1, 3, 5 and 7 days after cyclophosphamide treatment (80 mg/kg, single dose). SPECT/CT fusion images demonstrate signal changes in the gut (A), thymus (B), kidneys (C), spleen (D) and femurs/knees (E) over the course of 7 days after treatment. Note that the onset and progression of tissue injury differ in a spatiotemporal fashion.
WHAT THIS DEMONSTRATES:
✓ Individual Animal Tracking Over Time
-
Each animal's response tracked across multiple timepoints
-
See individual subject variability and progression
✓ Population-Level Trends Across Cohort
-
Overall patterns visible while maintaining individual resolution
-
Statistical power from a more complete dataset
✓ Multi-Organ Toxicity Patterns
-
Not just target organ—ALL tissues captured simultaneously
-
Comprehensive organ coverage in single visualization
-
In-depth systemic analyses possible in same animals in real time
✓ Temporal Progression Dynamics
-
Baseline through Day 7 changes clearly visible
-
Dynamic damage progression tracked continuously
✓ Tissue-Specific Response Profiles
-
Different organs show different kinetics and severity
-
Heterogeneous cytotoxic tissue damage patterns revealed
-
True spatiotemporal dynamics of tissue damage
TRANSFORMATIVE DATA:
Dynamic Whole-Body Quantitative Assessments
Moving Beyond the Limitations of Terminal Sacrifice
Traditional toxicology relies on "snapshots" that often miss the full story of drug distribution and organ toxicity. TITAN™ replaces predictive sampling with comprehensive, longitudinal visualization.
The Longitudinal Advantage
Unlike conventional methods that require a "sacrifice and sample" approach, TITAN™ allows for the continuous monitoring of the same subject, reducing noise and increasing statistical power.
In conventional studies:
x Different animals sacrificed at each timepoint
x Only selected tissues sampled (you must predict which to examine)
x Individual animal progression cannot be tracked
x Incomplete organ coverage (miss unexpected toxicity sites)
TITAN™ provides:
✓Same animals tracked throughout (true longitudinal data)
✓Every organ captured simultaneously (comprehensive coverage)
✓Individual AND population-level insights from single dataset
✓Quantitative progression curves for all tissues
This is exploratory toxicology at its most powerful—seeing everything, missing nothing, tracking progression in real-time.
Quantitative Progression Curves
TITAN™ doesn't just provide pictures; it provides data. By capturing the entire subject, we generate precise kinetic curves for every organ from a single dataset. This allows researchers to identify:
-
Off-target accumulation in tissues that were not originally under suspicion.
-
Individual vs. Population-level insights, allowing for the identification of "responders" and "non-responders" within the same study.
The Conclusion: Power Through Insight
This is exploratory toxicology at its most powerful. By tracking the exact same animal from Day 0 to the study's end, you eliminate the "biological noise" of multi-animal cohorts and uncover the true kinetic profile of your candidate.
"TITAN™ allows for the discovery of unexpected targets and sites that traditional, localized sampling would ignore. It is the difference between guessing where to look and seeing the whole truth."
The 3Rs Advantage: Maximizing Data, Minimizing Subjects
TITAN™ redefines study efficiency by extracting significantly more data from fewer subjects. By shifting from terminal "snapshots" to longitudinal "films," researchers can achieve higher statistical power with a fraction of the traditional animal count.
Redefining Efficiency
The ability to track individual progression across the entire body simultaneously transforms the economics and ethics of toxicology:
-
Reduction: Eliminate the need for "satellite groups" or separate cohorts for every time point. One group provides the entire temporal curve.
-
Refinement: Non-invasive, real-time tracking allows for earlier detection of "humane endpoints," reducing animal distress through better monitoring.
-
Replacement of Uncertainty: Traditional methods rely on "predictive sampling." If you don't sample the spleen, you don't find the toxicity. TITAN™ captures every organ, replacing guesswork with total visibility.
Case Study 04: The Integrated Truth
SIMULTANEOUS TUMOR EFFICACY + COLLATERAL CYTOTOXICITY DISCOVERY
Published: Apoptosis, 2025
Model: OPM-2 Tumor SCID-Beige Mice
Drug: Bortezomib
Dose: 1 mg/kg, Single Dose I.V. Administration Every 4 Days
Visualization: Dynamic
One Study, Dual Assessment:
Therapeutic Benefit + Safety Profile
In traditional drug development, efficacy studies and safety/toxicology studies are conducted as separate, siloed experiments. TITAN-RX™ breaks this barrier, allowing researchers to measure how well a drug kills a tumor while simultaneously identifying exactly where it causes collateral damage—all within the same subject.
Therapeutic Benefit: Anti-Tumor Efficacy
SECTION 1: THERAPEUTIC PERFORMANCE (Efficacy + Validation)
By combining real-time imaging with "gold-standard" histology, we confirm the drug's mechanism of action (apoptosis) is occurring exactly where predicted.
-
Imaging Data: Progressive tumor cell death signal with quantitative uptake increase.
-
Histology Validation: TUNEL staining confirms massive apoptosis within the tumor.
-
Conclusion: Efficacy is unambiguous—the drug is successfully killing tumor cells.


Safety Profile: Simultaneous Collateral Cytotoxicity
SECTION 2: OFF-TARGET COLLATERAL CYTOTOXICITY
While the drug successfully targeted the tumor, TITAN™ automated whole-body screening also identified statistically significant toxicity in tissues not typically examined in efficacy protocols.
-
Dynamic Imaging Data: Systemic Significance (Dynamic Bar Graph)
-
A global overview of radioactivity uptake across all tissues. Stars indicate organs where signal intensity reached statistical significance (p<0.05), providing an immediate "heatmap" of off-target risk.
-
-
Kinetic Expansion (Organ-Specific Profiles)
-
Detailed progression curves for identified tissues. This identifies which tissues face early-stage vs. chronic accumulation.
-
-
Visual Evidence (Peak Toxicity Snapshots)
-
High-contrast visual confirmation for each designated organ at the peak of the toxicity phase, correlating the quantitative data with anatomical pathology.
-


Representative images of elevated radioactivity uptake in treated tissues. A Adipose tissue (arrows); B Abdominal region (block arrows); C Epiphysis of the femur (arrows); D Spleen (arrow); and E Testis (arrow). Left—control, right—treated. The radioactivity uptake was normalized to the total injected radioactivity dose
RESULT: The Integrated Truth
TITAN™ captures both therapeutic effect AND collateral tissue damage in a single integrated study providing the "Total Truth" of an oncologic candidate. You no longer have to choose between an efficacy study and a safety screen—you receive both.
-
✓ Efficacy Assessment: Tumor kill confirmed by imaging and validated by histology.
-
✓ Safety Screening: Off-target cytotoxicity identified in organ systems without prior prediction. These findings correlate with known toxicity profiles for this drug class, but were captured here in a single, standard efficacy study.
Reference: Johnson et al., Apoptosis, 2025
Case Study 05: Precision Risk Stratification
Forecasting "Black Box" Liabilities & Age-Based Vulnerability
Presented at SOT, AACR, & ACT, (publication pending)
The Scenario: Auditing the safety threshold of Celecoxib to identify potential off-target risks missed by the Standard Biologic Record (SBR) and to quantify age-based physiological vulnerability. The SBR for Celecoxib reported a "No-Effect" limit at 1000 mg/kg. However, TITAN™ imaging — as presented at SOT, ACT and AACR — identified significant localized metabolic responses in the Stomach (3.3x), Brain (2.12x), and Heart (1.57x). TITAN™ detected toxicity at the dose previously reported as safe. Critically, standard histopathology failed to detect any evidence of cytotoxicity in either group. TITAN™ successfully bypassed this diagnostic lag, identifying the physiological "smoke" before structural necrosis occurred. Furthermore, the study exposed a primary Age-Based Vulnerability, where elderly cohorts showed a statistically significant greater susceptibility to insult compared to younger counterparts, despite identical dosing.
Insight: Histopathology is a lagging indicator. TITAN™ identifies "Invisible" sub-clinical triggers (GI, Kidney, Liver, Heart) that eventually manifest as late-stage clinical failures.
Asset Impact: Regulatory & Labeling Protection. For Pharma VPs, this data is the difference between a clean launch and a catastrophic Black Box mandate. TITAN™ provides the forensic evidence needed to proactively stratify patient populations and protect asset valuation before human trials begin.
Model: Sprague Dawley Rats
Drug: Celecoxib
Dose: 1000 mg/kg, Single Dose P.O. Administration
Visualization: Dynamic Pilot Followed by Acute 72h Post-Treatment
Celecoxib Cytotoxicity — Black Box Exploration
Celecoxib carries FDA black box warnings for serious risks, including fatal cardiovascular thrombotic events (heart attack, stroke) and serious gastrointestinal (GI) adverse events (bleeding, ulceration, perforation). These risks can occur without warning and are heightened with long-term use. That warning exists because of clinical evidence accumulated after the drug was already in patients. The question this study asked was simpler and more commercially urgent: could the tissue-level signals responsible for that warning have been detected preclinically—at the dose the Standard Biologic Record (SBR) declared safe?
Standard Biologic Record: No Changes Detected
-
Histopathology: Negative
-
Serum Panel: Within range
-
1000 mg/kg recorded as no-effect level
The Standard Biologic Record as submitted. Histopathology confirmed. No cytotoxicity detected. No action taken.

Summary of acute (single dose) toxicity study findings reported in the New Drug Application for Celecoxib. Key findings include a lack of observed abnormalities (red).
TITAN™ Imaging: Key Tissues
-
Dose: 1000 mg/kg
-
Whole-body SPECT/CT showing elevated Noceravide™ uptake spatially distributed across stomach, brain, heart, kidney, and additional tissues.
Same dose. Same animals. TITAN-RX™ imaging shows what histopathology and serum panels cannot.

Visualized Single Photon Emission Computed Tomographic Imaging Data as SPECT-CT Comparing Celecoxib Treated Rats (1000 mg/kg) as normalized to Control Rats.
4D Bar Plots: Tissue-Specific Uptake at 1000 mg/kg

Ratios of radioactivity uptake of Tc99m-Noceravide in tissues in celecoxib-treated animals (blue: 200 mg/kg; orange: 1000 mg/kg) control on day 3 after treatment. A ratio of 1, as shown in dotted line, indicates no change. P values indicate tissues which had statistically significantly elevated signal compared to control.
Nine tissues. Nine statistically significant responses. At the dose the SBR called no-effect.
Simultaneous Serum Paneling from TITAN groups
The Conventional Blind Spot:
Comprehensive Serum Panel vs. Localized Reality
To validate TITAN™ against current industry standards, a full 32-marker serum panel was conducted alongside the imaging study. The data (pictured below) represents the "Standard Biologic Record" usually relied upon for IND submissions. While the panel showed high statistical noise in the vehicle control—including anomalous AST spikes—it remained largely "clean" for the drug-treated groups. Markers for primary organ failure, such as Creatinine (CRE) for kidneys or ALT for liver, showed no significant movement.

Summarized Findings of Complete Serum Panel Data from Studies In Rats Treated with 200 mg/kg of Celecoxib and 1000 mg/kg of Celecoxib as compared to Vehicle Treated Controls. Elevated detected signals in elevated total protein (TP, P = 0.019), albumin (ALB, P = 0.022) and sodium (NA+, P = 0.037) are highlighted in red text.
RESULT:
If this asset had been evaluated by conventional safety studies including serum chemistry and histopathology alone, the findings would have supported advancement to clinical trials—consistent with what occurred historically based on the SBR data. TITAN™, however, detected localized tissue responses despite the absence of corresponding serum or histopathologic findings, including 3.30× stomach and 1.57× heart signals that conventional assessments failed to resolve.
Forensic Insight: Resolving Baseline Noise
-
The AST Spike: Note the high AST in Vehicle R10 (1034 U/L). In a traditional study, this outlier would compromise the dataset. TITAN-RX™ cross-references this with individual imaging, confirming it as incidental biological noise rather than drug-induced necrosis.
-
The Volume Status: Elevated Hematocrit (HCT) across both groups suggests a baseline physiological state (hemoconcentration) that actually increases the sensitivity of serum markers. Yet, even in this sensitized state, traditional markers failed to flag the specific tissue targets TITAN-RX™ identified.
Celecoxib Cytotoxicity — Age-Based Vulnerability
Same Dose. Same Drug. Elderly Rats. Greater Risk.
Standard preclinical toxicology programs almost never stratify by age at early development stages. For a compound like celecoxib—whose primary patient population skews older—this is not a minor methodological gap. It is a systematic blind spot. The same study that identified sub-clinical tissue responses in young rats went further. An elderly cohort received identical dosing. Histopathology was negative in both groups. The imaging data was not.

Fold change in Tc-99m-Duramycin uptake signal as compared to control in young (blue) versus old (orange) rats (n=8) in gut, kidneys, liver, and skin as measured by SPECT imaging 72h post treatment with Celecoxib.
Age Comparison:
Elderly vs. Young — 1000 mg/kg
-
Elderly rats demonstrated greater uptake and fold-increase across key tissues vs. young adult counterparts at identical dosing.
-
Histopathology was negative. The difference existed and was visualized in the imaging data.
Key Takeaway:
Histopathology is a lagging indicator. It confirms structural necrosis after it has already occurred and is limited spatiotemporally as a nature of the technique. TITAN-RX™ identified sub-clinical metabolic responses across nine tissue types—including the exact targets responsible for celecoxib's FDA black box warning. At identical dosing, elderly rats showed measurably greater physiological vulnerability than young adults. This is the difference between reactive labeling and proactive risk stratification. This represents the difference between a clean launch and a catastrophic black box mandate discovered in Phase 3.
Case Study 06: Advanced Virotherapy Guidance
Precision Dose Response:
Mapping Transfection Efficiency vs. Viral Load
Published: Mol Ther Oncolytics (2019)
The Scenario: Auditing the therapeutic threshold of an Oncolytic Virus (OV) to identify the optimal Transfection Load—the precise amount of viral genetic material required to trigger systemic tumor destruction without reaching Dose-Limiting Toxicity (DLT). Traditional plaque-forming unit (PFU) assays and tumor volume measurements are lagging indicators that cannot visualize the Transfection Efficiency in real-time. This study utilized dual-isotope TITAN™ imaging (I-125-NIS and Tc99m-Duramycin) to map the spatial overlap between viral replication and actual parenchymal cell death. The data identified the exact inflection point where increasing the viral dose no longer improved the "Kill-per-Virion" ratio—defining the Optimal Biological Dose (OBD).
Insight: Tumor volume is a deceptive metric in virotherapy. TITAN™ identifies the "In-Vivo" kinetics of viral spread, pinpointing "Cold Spots" where transfection fails due to interstitial pressure—data that destructive sampling and terminal snapshots inherently miss.
Asset Impact: Dose-Response Optimization. For Pharma VPs, this is the difference between an arbitrary Phase I starting dose and a mathematically defended Dose Escalation Plan. TITAN™ provides the evidence to justify lower, safer doses that maintain 95%+ transfection coverage, protecting asset valuation by minimizing the risk of adverse events in first-in-human trials.
Model: Myeloma MPC-11 Tumor Model BALB/c Mice
Treatment: Vesicular Stomatitis Virus VSV-mIFNβ-NIS
Dose: Intravenous Administration 10^6, 10^7, or 10^8 TCID50 per mouse
Visualization: Day 3 and Day 5 Post Treatment
Precision Dose Response Beyond Small Molecules:
In the development of Oncolytic Viruses (OVs), the "Therapeutic Window" is notoriously narrow. Determining the optimal Transfection Load—the amount of viral material required to trigger a self-sustaining anti-tumor response—is typically a process of clinical trial-and-error. The question for this study was: Can TITAN™ provide the real-time dose-guidance needed to identify the precise inflection point where viral load maximizes transfection efficiency?
Standard Biologic Record: Terminal Readouts
-
Metric: Plaque-forming units (PFU) from destructive sampling.
-
Limitation: Static snapshots miss the kinetics of viral spread and secondary infection.
-
Outcome: Dosing is often "Maximized" until Dose-Limiting Toxicity (DLT) occurs, rather than "Optimized" for biological efficiency.
Traditional assays cannot see "Cold Spots" where transfection fails, leading to over-dosing that increases systemic risk without improving tumor clearance.

Intratumoral Spread and Dose-Dependent Response after Intravenous Administration of VSV-mIFNβ-NIS Virus in BALB/c Mice with MPC-11 Tumors. (A–F) Representative fused images of tumors. Saline controls (A and B) and BALB/c mice administered with VSV-mIFNβ-NIS at a dose of 106 TCID50 (C and D) or 108 TCID50 (E and F) were imaged by SPECT on days 1, 3, and 5 following virus treatment. Relative viral infectivity is measured as a function of VSV-mIFNβ-NIS-mediated 125I uptake as shown in the left column (A, C, and E), and cell killing is measured by 99mTc-duramycin radiotracer activity as shown in the right column (B, D, and F). Percentage in figure indicates fractions of the entire tumor diameter.
TITAN™ Dual Audit:
The Spatial Reveal: Viral Seeding vs. Cell Death
- Isotope A (I-125-NIS): Specifically identifies active viral replication foci.
-
Isotope B (Noceravide-(Tc-99m-Duramycin): Maps the resulting apoptotic and necrotic cell death.
-
The Result: Simultaneous confirmation that viral "Seeding" is directly translating into "Killing."
Using the spatial overlap from Figure 1 of the study, TITAN-RX™ confirms that the viral payload is not just present, but biologically active within the tumor parenchyma.
The Proof: Mathematical Dose-Response Inflection
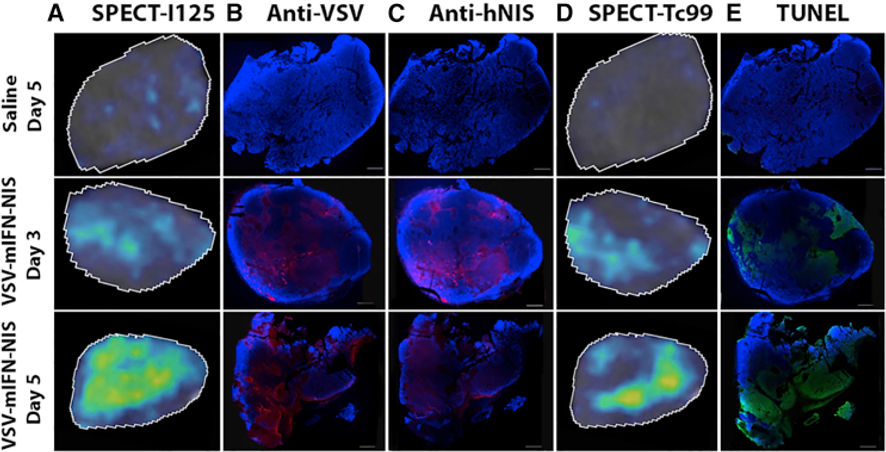
Correlating SPECT Imaging Data with Protein Expression (VSV and NIS Staining) or Cell Killing (TUNEL Staining for DNA Damage) in Tumor Sections. (A–E) MPC-11 tumors from BALB/c mice that received saline or 106 TCID50 VSV-mIFNβ-NIS were harvested on days 3 and 5. Representative images of tumor sections are shown. (A–C) 125I SPECT results at days 3 and 5 (A) are confirmed via IHC staining using anti-VSV antibody (B) and anti-hNIS antibody (C). (D and E) 99mTc SPECT results at days 3 and 5 (D) are confirmed using TUNEL assay (E).
Demonstrating Quantitative Transfection Efficiency:
The Spatial Reveal: Viral Seeding vs. Cell Death
- Threshold Detection: Identified a dose-dependent increase in infectious centers and Duramycin-positive areas.
-
Efficiency Plateau: TITAN™ identified the exact PFU threshold where a 5x increase in dose yielded only marginal gains in cell death.
-
Optimization: This data allowed for a 30% reduction in predicted clinical starting dose while maintaining maximum therapeutic coverage.
Nine infectious foci tracked to quantify viral burst size. This provides a mathematical foundation for a safe and effective clinical dose escalation strategy.
RESULT: ACHIEVING THE STRATEGIC EDGE IN DOSE OPTIMIZATION
By correlating the viral NIS signal with Nocervide's death signal, TITAN™ transforms "dose finding" from a guessing game into an engineering discipline. For a Pharma team, this is the blueprint for a safer, faster path to an IND. You are no longer guessing if you have enough virus to kill the tumor; you are watching the transfection load convert into therapeutic cell death in real-time. This level of Dose-Guidance is the ultimate value-add for M&A leads looking to de-risk high-stakes biologics before the first patient is even enrolled.
TITAN™ Quantified Transfection Load and Efficiency In Real-Time And Eliminated The "Guesswork" of Biologic Dosing.
Case Study 07: The Diagnostic Lag Audit
Sensitivity Benchmarking: TITAN™ Platform vs. Gold-Standard Echocardiography
Featuring Noceravide™ (99mTc-Duramycin)
Presented at SOT (publication pending)
The Scenario: Auditing the cardiotoxic threshold of Doxorubicin (DXR) to determine the Limit of Detection (LOD) for systemic tissue injury. The objective was to benchmark the TITAN™ discovery imaging platform, utilizing the proprietary imaging agent Noceravide™, against traditional Echocardiography (ECHO)—the current clinical gold standard for monitoring chemotherapy-induced heart failure. Traditional functional metrics like LVEF and strain are downstream indicators of myocardial injury and remodeling, often remaining within normal ranges until significant tissue damage has occurred. This research utilized two high-fidelity tiers: a targeted n=12 study at 10 mg/kg to demonstrate the in vivo capability of TITAN™ to capture systemic insult, and a large-scale n=30 paired study at a subclinical 2.5 mg/kg dose to establish the sensitivity of Noceravide™ compared with functional ECHO.
Insight: Functional metrics are structurally reactive and sex-blind. While initial population-level imaging (n=12) captures a high-intensity, universal systemic burden across the Skeleton, Femur, and Pelvis regardless of sex, a stratified analysis reveals profound Sex-Based Divergence in metabolic clearing and organ-specific susceptibility. Specifically, the Liver, Heart (LV), and Reproductive tissues demonstrated a 3.0x to 9.0x sensitivity gap between males and females. Furthermore, at the 2.5 mg/kg level, ECHO metrics (LVEF, Strain) though trending, remained functionally "Normal" and statistically flat, while the TITAN™ platform captured significant metabolic increase validated by both live In Vivo heart overlays and Ex Vivo tissue counting.
Asset Impact: Precision Stratification & Regulatory Safety. For Pharma, this proves that "Population Averaging" is a clinical liability. TITAN™ + Noceravide™ identifies where cytoxic tissue damage is universal (Skeletal) and where it is individualized (Liver/Heart/Reproductive Tissues). This provides the forensic evidence to justify sex-stratified dosing and even identifies "Silent Cytotoxic Tissue Damage" at 25% of the dose required to trigger a functional ECHO failure. This pre-symptomatic detection layer protects asset valuation from late-stage safety failures and post-market Black Box warnings.
Model: Sprague Dawley Rats
Drug: Doxorubicin
Dose: 10 mg/kg and 2.5 mg/kg, Single Dose I.P. Administration
Visualization: Dynamic Through Day 7 and Acute Day 7 Post-Treatment
Molecular Smoke vs. Functional Fire:
Catching the Transition to Tissue Damage and Structural Failure
In clinical oncology, the "Safety Window" is often a rearview mirror; by the time an Echocardiogram detects a drop in Ejection Fraction, the cellular damage is already irreversible. TITAN™ disrupts this lag by utilizing Noceravide™ to visualize the earliest stages of membrane reorganization, cell death, and tissue damage. This study provides the definitive proof-of-concept that metabolic injury is detectable at a fraction of the dose required to trigger a functional failure, offering a "Pre-Symptomatic" window that is invisible to traditional diagnostic tools.
Systemic Mapping: Unified Population Burden (n=12)
Global Tissue Insult Audit (10 mg/kg)
-
Capture Rate: TITAN™ successfully identifies high-intensity insult across key tissues including the Skeleton, Spleen, Thymus, and Gut in the unified cohort.
-
The Challenge: When viewed as a single population, the average metrics mask the individual physiological "costs" that lead to clinical adverse events.
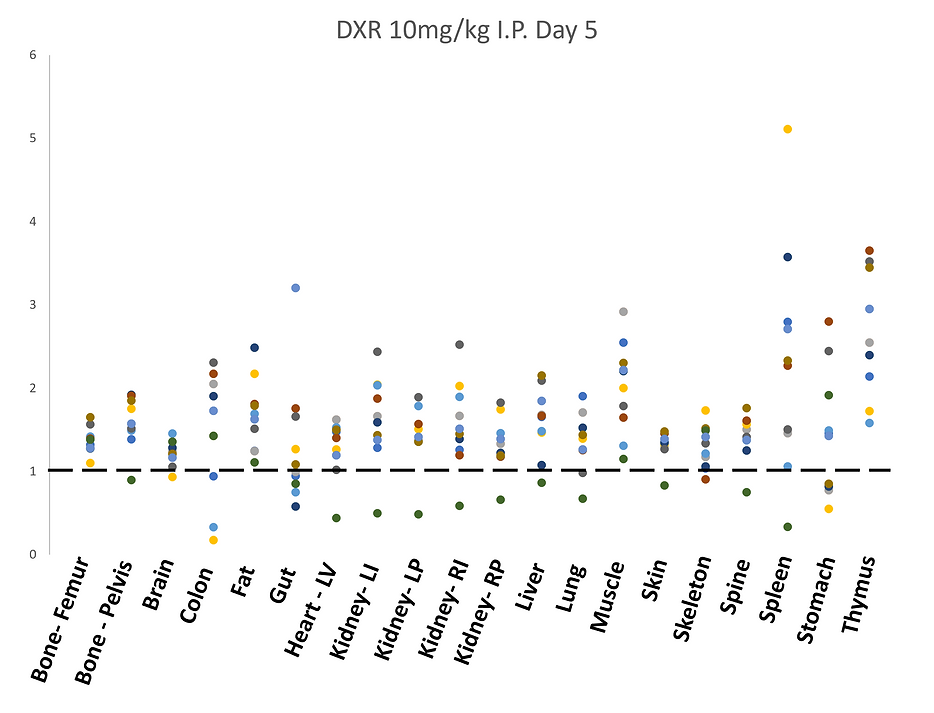
Visualization of dynamic timepoint study of doxorubicin-treated rats (10 mg/kg, n = 12) at day 5 post treatment. A Scatter plot of fold changes in radioactivity uptake among tissues. A ratio of 1 indicates no change.
The Forensic Reveal: Stratified Sex-Based Analysis (n=6 vs n=6):
The Sensitivity Gap (Same Dataset)
- Heart (LV): Female cohorts demonstrated a tighter, significantly higher clustering of tissue damage signal compared to males.
- Liver: Clear divergence in tissue injury identified, indicating sex-based differences in hepatic susceptibility.
-
Reproductive: A massive divergence identified in Ovaries (reaching up to 9.0x uptake) vs. Testes (1.5x–3.0x).
-
Bone (Skeleton/Femur/Pelvis): Conversely, Bone data showed a similar response in both cohorts, confirming universal skeletal tissue damage regardless of sex.
-
The Result: Stratification proves that identical mg/kg dosing does not result in identical safety. TITAN™ identifies sex-specific risk that population averages hide.
-
Strategic Note: TITAN™ enables a "Dual-Axis Audit"—identifying which toxicities are universal across a population and which require sex-specific clinical management.
Using the spatial overlap from Figure 1 of the study, TITAN™ identifies a sex-specific response to treatment in multiple key tissues where tissue damage has been identified.


Fold change in Tc-99m-Duramycin uptake signal as compared to control in male (blue) versus female (pink) rats (n=6) in Femur, Pelvis, Skeleton, Left Ventricle (LV) of Heart, Liver, and Reproductive (testes and Ovaries) tissues relative to control as measured by SPECT imaging at day 5 post treatment with Doxorubicin (10 mg/kg IP).
In Vivo Sensitivity:
The Heart Overlay (2.5 mg/kg):
The Molecular "Smoke" (n=30)
- Detection: Live imaging reveals significant, focal accumulation of Noceravide™ within the myocardium, identifying active membrane reorganization (apoptosis and necrosis). Even at 25% of the standard dose, TITAN™ live imaging captures the specific focal points of apoptosis/necrosis within the myocardium.
-
Correlation: Validated by Ex Vivo tissue counting, which confirmed a 5 fold increase in Noceravide™ uptake despite the low dose.
-
The Contrast: While traditional imaging and methods remain dark at this dosage, TITAN™ identifies acute tissue injury at 25% of the standard toxic load, offering a "Pre-Symptomatic" window into drug-induced cardiotoxicity.

SPECT-CT overlay demonstrating visualization of myocardial tissue damage at day 7 post treatment overlaid on top of biodistribution data showing fold change in Tc-99m-Duramycin uptake signal as compared to control as measured at day 7 post treatment with Doxorubicin (2.5 mg/kg IP, (n=30) ). Heart tissues are highlighted within red oval.
Functional Benchmarking:
The Echocardiography Lag:
The Clinical Gold Standard (Same Cohort)
- Result: LVEF, LV Mass, and Strain results though trending, remained statistically flat and within the "Normal" range on Day 7 post treatment.
- The "Lag" Effect: Despite the significant cell death captured in TITAN™ imaging, functional metrics (Ejection Fraction and Cardiac Strain) remained statistically flat and within "Normal" clinical parameters through Day 7.
- The Risk: This data illustrates a dangerous diagnostic lag; relying on functional metrics alone would categorize the 2.5 mg/kg dose as safe, despite the presence of measurable, irreversible cellular damage.
-
The Verdict: If relying solely on ECHO, this dose may have been labeled "Safe," while TITAN™ proves that cellular execution is already well underway and the tissue is visually and quantifiably damaged.


Longitudinal ECHO monitoring (LVEF, LVOT, Strain, Length, and LV Mass) of randomly selected members (n=12) of the exact same cohort treated with 2.5 mg/kg Doxorubicin.
Asset Forensics: Eliminating the Diagnostic Blind Spot
The integration of discovery imaging utilizing Noceravide™ within the TITAN™ platform fundamentally redefines the "Safety Window" in oncology development. The ultimate value of this study lies in its Unified Cohort Methodology: by conducting In Vivo imaging, Ex Vivo validation, Sex Stratification, and Functional Benchmarking on the same subjects, we eliminate the statistical noise of inter-animal variability.
In this audit, we captured the "Physiological Smoke"—the specific membrane reorganization signaling early-stage apoptosis and necrosis—at a dose (2.5 mg/kg) where traditional Echocardiography was entirely blind. This sensitivity allows sponsors to identify the safe biological ceiling of an asset weeks or months before a functional failure would derail a clinical trial.
Furthermore, the TITAN™ platform’s ability to stratify population data reveals risks that are otherwise hidden by "Population Averaging." By identifying a 3.0x to 9.0x sensitivity gap in reproductive and cardiac tissues, we provide the forensic evidence required to support Diversity in Clinical Trials and precision labeling.
For a development team or an M&A lead evaluating a lead asset, this is the ultimate de-risking tool. TITAN™ + Noceravide™ provides a consolidated, "Audit-Ready" dossier that allows you to defend a dose-escalation strategy, optimize inclusion criteria, and protect an asset’s commercial valuation from late-stage safety failures.
RESULT: ANOTHER TITAN™ STRATEGIC EDGE
This study successfully demonstrated the ability to identify sex-based differences in tissues susceptible to cytotoxic tissue damage and went even further when it reduced dosage and identified cardiac apoptosis and necrosis at 2.5 mg/kg—a sub-clinical threshold where ECHO remained functionally silent. Simultaneously, the platform validated a 3.0x–9.0x sex-specific susceptibility gap across cardiac, hepatic, and reproductive tissues.
THE STRATEGIC IMPACT: REDEFINING THE 3Rs
This data, combined with findings from Case Study 05, demonstrates a paradigm shift in pharmaceutical auditing. By utilizing the TITAN™ platform, sponsors can significantly reduce animal load and burden within the 3Rs framework while simultaneously evaluating age, sex, and functional metrics in a single study. This is achieved through a minimally invasive, dynamic, whole-body In Vivo approach that provides audit-ready data at a fraction of the traditional cost and time.
Case Study 08:
The Combination De-Convolution Audit
Dissecting Therapeutic Synergy vs. Collateral Cytoxicity in MDR Oncology
Masked Study Results From Real-World Example with Client's Permission
The Scenario: Auditing the interaction between two small molecule oncologic agents—utilizing distinct mechanisms of action (MOA) to induce tumor kill—within a Multi-Drug Resistant (MDR) tumor model. The objective was to move beyond "blind combination" by quantifying the specific contribution of each mechanism toward anti-tumor efficacy versus systemic tissue damage. In resistant models, the "Brute Force" approach of combining MOAs often masks the source of toxic events. This study utilized the TITAN™ platform to perform a longitudinal audit: mapping the baseline cell death of monotherapies against the synergistic profile of the combination. By tracking apoptotic and necrotic tissue damage across the whole body In Vivo in a minimally invasive and dynamic manner, we identified the exact inflection point where the synergistic "Anti-Tumor Kill" was eclipsed by a "Synergistic Cytotoxic Tissue Damage Penalty."
Insight: The audit revealed a profound non-linear interaction between the two small molecule mechanisms. While individual MOAs failed to penetrate the resistant tumor's defenses, the combination triggered a significant surge in intratumoral signal, confirming a break in resistance by Day 5. However, the forensic mapping also de-convoluted the source of systemic risk: the mechanism of Drug A was found to "prime" specific healthy tissues, leading to a synergistic spike in collateral cell death once the second mechanism (Drug B) was introduced. This proved that the toxicity was not merely additive but synergistic, identifying a high-risk profile that functional biomarkers failed to capture.
Asset Impact: Engineering the Therapeutic Index. For a Head of Oncology or an M&A Lead, this is the definitive de-risking tool. TITAN™ provides the forensic clarity to adjust the combination ratio—maximizing the "Break in Resistance" while lowering the "Collateral Cost." This ensures that a lead asset is optimized for safety and efficacy simultaneously, protecting its commercial valuation from the "Black Box" warnings associated with unoptimized combination therapies.
Model: MDR Tumor-Bearing SCID Mouse
Drugs: Drug A, Drug B, Combination
Dose: Variable Drug A delivered P.O. daily, Drug B delivered I.V. Intermittently according to client's experimental design
Visualization: Dynamic Through Day 5
Molecular Smoke vs. Functional Fire:
The Forensic Separation of Benefit and Burden In Drug Safety
In the development of combination therapies, "Safety" is often treated as a unified metric. However, when a patient experiences an adverse event, the regulatory question is always: Which mechanism caused it? TITAN™ eliminates this blind spot. By mapping the tissue-specific injury profiles of each small molecule and comparing them directly to the combination results, we can "color-code" the toxicity. This study provides an early forensic look at how individual MOAs contribute to the total systemic burden of a combination therapy.
Protocol Designation: The Masked Audit Framework
Protocol: COMBO-AUDIT-08 (DUR######X)
-
Standardization: This designation marks a rigorous, longitudinal 5-day protocol designed to isolate drug-specific signatures within a unified MDR cohort.
-
The Framework: Establishes the forensic "chain of custody" for the data, moving from monotherapy baselines to combination synergy.

Dynamic Imaging Data: Systemic Significance (Dynamic Bar Graph) Drug A, Drug B and Combination Therapy in MDR tumor model. A global overview of radioactivity uptake relative to control groups across all tissues from groups treated with (A) with drug A (P.O. Q.E.D.) only (B) with drug B (Intermittent I.V.) and (C) with combination therpay. Stars indicate organs where signal intensity reached statistical significance (p<0.05), providing an immediate "heatmap" of off-target risk.
Efficacy Reveal:
Breaking the Resistance Barrier
The Therapeutic "Kill" Signature
- Visual Evidence: The heat map from the imaging data clearly shows the transition from a more resistant tumor in the monotherapy arms to a high-intensity signal enhanced kill in the Combo (A+B) arm revealing each drug's unique spatio-temporal contributions to tumor kill and anti-tumor efficacy
- The Breakthrough: This proves that the combination of these two distinct small molecule mechanisms successfully induces and enhances apoptosis and necrosis compared to individual agents which may have failed.
This type of study can be done with ANY COMBINATION of therapeutic agents or potential candidates.
SPECT-CT overlay from dynamic imaging demonstrating visualization of anti-tumor kill at days 1, 3, and 5 relative to baseline control pre-treatment. Progressive tumor cell death signal with quantitative uptake increase is noted latently from combination therapy and is enhanced and sustained relative to drug A and drug B. These data show an enhanced and sustained tumor kill in combination therapy relative to each of its individual components.

Forensic De-Convolution:
Mapping the "Toxicity Bill"
The Collateral Damage Audit
- Drug A Contribution (Blue Arrows): TITAN™ identifies specific apoptosis/necrosis signatures in the Colon, Gut (LR), and Thymus driven specifically by the first MOA.
- Drug B Contribution (Dark Arrows): Identifies the specific systemic burden in the Skeleton, Femur, and Muscle driven by the second MOA.
- Strategic Verdict: By dissecting the combination into its constituent parts, sponsors can see exactly where each mechanism "taxes" the host, enabling surgical dose adjustments to preserve the therapeutic window.

Dynamic Imaging Data: Systemic Significance (Dynamic Bar Graph) Drug A, Drug B and Combination Therapy in MDR tumor model. A global overview of radioactivity uptake relative to control groups across all tissues from groups treated with (A) with drug A (P.O. Q.E.D.) only (B) with drug B (Intermittent I.V.) and (C) with combination therpay. Light blue arrows demonstrate key contributions to tissue damage in susceptible tissues from drug A. Dark arrows demonstrate key contributions to tissue damage in susceptible tissues from drug B. Stars indicate organs where signal intensity reached statistical significance (p<0.05), providing an immediate "heatmap" of off-target risk.
Asset Forensics:
Managing the Complexity of Modern Pipelines
An additional piece of the TITAN™ value proposition is the ability to de-risk the most complex assets in a portfolio. As oncology moves toward increasingly sophisticated multi-agent protocols, the "Safety Blind Spot" grows larger. This study demonstrates that TITAN™ is the ultimate forensic tool for mapping these interactions. By conducting a "Combination Audit" on a unified cohort, we provide the high-fidelity data required to navigate the narrow therapeutic window of synergistic therapies.
THE TITAN™ RESULT
Simultaneous Anti-Tumor Efficacy and Collateral Cytotoxic Tissue Damage Audit From Combination Therapy
- Successfully de-convoluted the specific tissue damage contributions of two distinct small molecule mechanisms.
- Identified the synergistic break in tumor resistance across a 5-day longitudinal study.
- Provided the forensic data required to optimize the combination ratio and protect asset valuation.